Status
Based on figure 1.3-a and figure 1.3-b below administrator can monitor appliance resource when administrator login into the system.
The steps to access Status are as follows:
On the Menu Bar, click Appliance Management. This will display a dropdown menu
To view DNSVault status page, click Status
Note The System Information will show Uptime(days, hours, minutes), Memory usage(%), CPU usage(%), Hard Disk usage(%), Current Time, IP dress(IPV4 & IPV6)
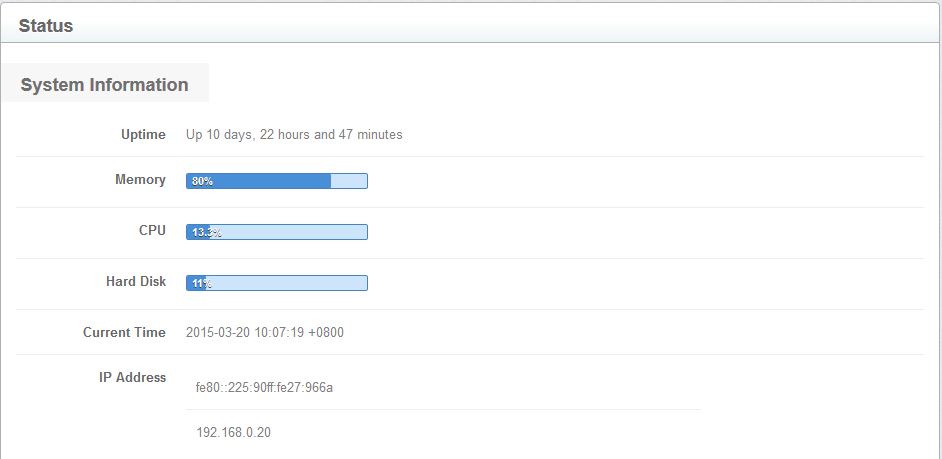
Figure 1.3-a : Status page
Note Daemon Status(Up\/Down) will show the status of DNS Daemon, Redis Daemon, Resque Daemon, Delayed Jobs, Log worker-named, Slave
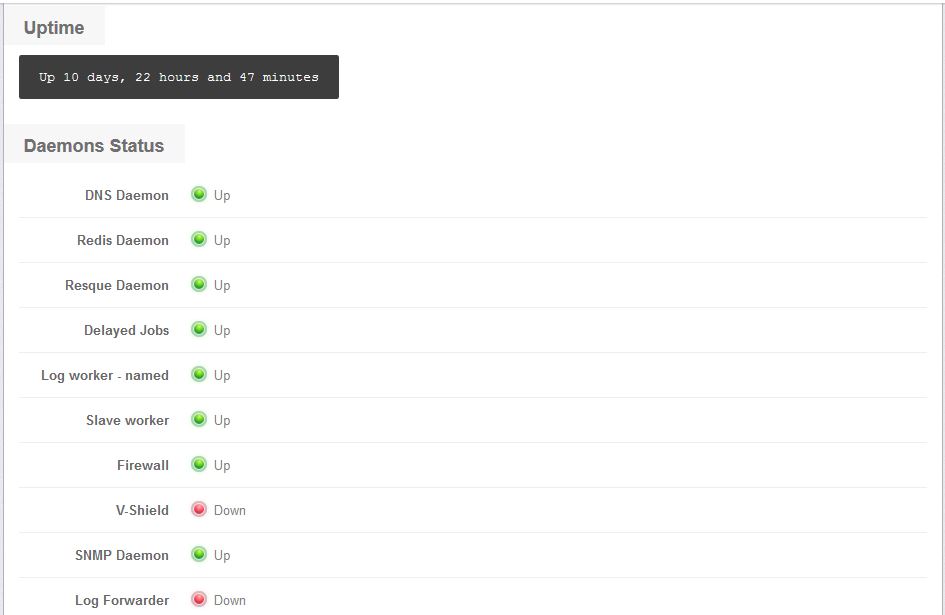
Figure 1.3-b : cont. Status page